Hidden waste: without this monitoring losses happen daily
In many manufacturing plants, more happens than the reports show. Machines are technically running, but performance is falling. Downtime is brief but frequent. Inventory builds up — and no one can clearly explain why. The real issue isn’t what’s happening — it’s that no one is tracking it properly.
The companies we work with often suspected they were losing efficiency somewhere — but couldn’t say where or how much. Without hard data on machine time, performance or micro-downtime, it’s hard to pinpoint where waste actually occurs.
In one factory, reporting was done manually in Excel once per shift. A morning downtime was logged only eight hours later. The same issue kept coming back — but there were no tools in place to detect it sooner.
Why does this happen?
The data often exists — but it’s fragmented or unused. Some of it sits in Excel, some in SCADA, some isn’t collected at all. There’s no central view showing what works, what slows production, and what causes waste.
Many manufacturers fear that real-time monitoring means replacing IT systems. In fact, most of the data already exists — it just needs to be connected and visualized.
Our approach
We begin with a shared analysis: What KPIs matter? Where is data missing? Where do teams need visibility? We integrate existing systems (MES, SCADA, Excel), and where needed, we add lightweight IoT sensors to fill the gaps.
The result: a real-time dashboard that shows where losses occur and how quickly you can act — with no guesswork or delayed reporting.
What does it deliver?
A clearer view of how production actually runs.
Faster identification and elimination of waste.
Operations and leadership teams gain access to live KPI data — enabling better, faster decisions every day.
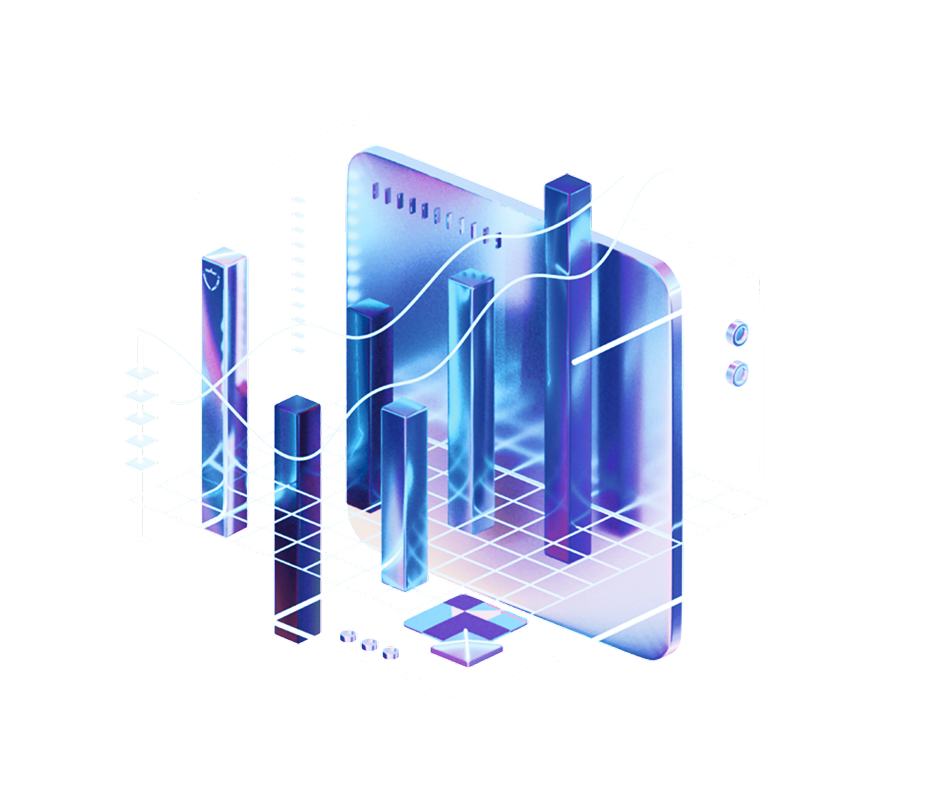
Traditional reports and spreadsheets make analysis slow and unclear. Tools like Power BI, Grafana, and Tableau turn complex data into visual dashboards.
This allows manufacturers and OZE operators to track performance, detect inefficiencies, and make data-driven decisions—faster and more accurately than ever before.
MES gives manufacturers and renewable energy operators real-time control over production and infrastructure.
By collecting and analyzing performance, quality, and equipment data, MES enables smarter scheduling, waste reduction, faster response to issues, and improved efficiency of both industrial and energy operations.
Data scattered across multiple systems is hard to analyze. ETL integrates information from sources like ERP, MES, and IoT, then standardizes and loads it into a central database.
This ensures data consistency, enhances reporting accuracy, and provides a single source of truth for operational and strategic decisions.
Manufacturers and OZE companies often detect failures too late due to a lack of real-time monitoring. IoT sensors continuously collect and transmit data from machines or installations to analytical dashboards.
This enables real-time insights, predictive maintenance, and better operational control—reducing downtime, costs, and energy losses.
Companies often store data in disconnected systems, causing delays and inefficiencies. Cloud databases centralize critical business information, enabling real-time access, better collaboration, and faster decision-making.
For OZE companies, they support dynamic energy management and integrate easily with forecasting tools and IoT infrastructure.